Q3 revenue fell 12.4% vs. Q2, driven by a 31% drop in APAC enterprise renewals after the August price change.
Jan▼ Below typicaltypicalSep
Jira Create Jira ticket
Alerts Alert APAC sales leads
Try
Q3 revenue fell 12.4% vs. Q2, driven by a 31% drop in APAC enterprise renewals after the August price change.
Jan▼ Below typicaltypicalSep
Jira Create Jira ticket
Alerts Alert APAC sales leads
LATAM is forecast at 108% of target (±3%), with pipeline coverage at 3.4×. Two expansion deals over €200k are due to close in the first month.
Q1ForecasttypicalQ4 forecast
Alerts Share with LATAM leads
PowerPoint Export to PowerPoint
Analgesics account for 29 of 100 adverse events this year, followed by NSAIDs (13) and antihypertensives (13). Serious events sit in two classes.
Analgesic▲ Above typicaltypicalAntiemetic
PowerPoint Export to PowerPoint
Anode View data quality
JiraOutput
AlertsOutput
AlertsOutput
PowerPointOutput
PowerPointOutput
AnodeOutput
Fig. 01Illustrative Tower answers using sample data
At a glance
Tower at a glance
What it is
An AI analytics platform that automates the BI workflow, from connecting data to dashboards and recommended actions.
Built for
Business executives and teams who need answers from their data without waiting on a BI team.
First dashboard
About 2 minutes after a supported data source is connected (our estimate).
Enterprise rollout
Typically a few weeks, including private data sources, SSO, roles and training (our estimate).
Analytics
Descriptive, predictive and prescriptive, with Story Mode slides you can export to PowerPoint, PDF or PNG.
Connectors
11 on Professional; 700+ on Enterprise, across databases, warehouses, SaaS apps, APIs and files.
Actions
Create Jira tickets, raise ERP restock requests or assign CRM tasks straight from a chart.
Inside other tools
Plugins for Spotfire, Snowflake (Native App) and Grafana, on request.
Security
Role-based access control, encryption at rest and in transit, audit logging and SSO. No third-party certifications today.
Pricing
Explore: free. Professional: $100 per user per month. Enterprise: custom, on tiered credits.
Trial
Free, on request.
Where to get it
From Codygon directly, or on Azure Marketplace as a private offer. Web app, with private iPhone, iPad and Android apps on request.
Heard from executives
"I'm paying $20,000 for two report edits. I still have to explain every detail like it's the first time. If only I could do it myself..."
A senior executive at a big pharma company
The problem
The Executive's Dilemma
Executives spend millions on analytics solutions that take months to build and are inflexible to change. Last-minute dashboard requests create bottlenecks and stress for teams.
6-8 weeks for simple dashboard changes
$20K+ consultant fees for minor modifications
Technical complexity blocks business users
The solution
Tower's Solution
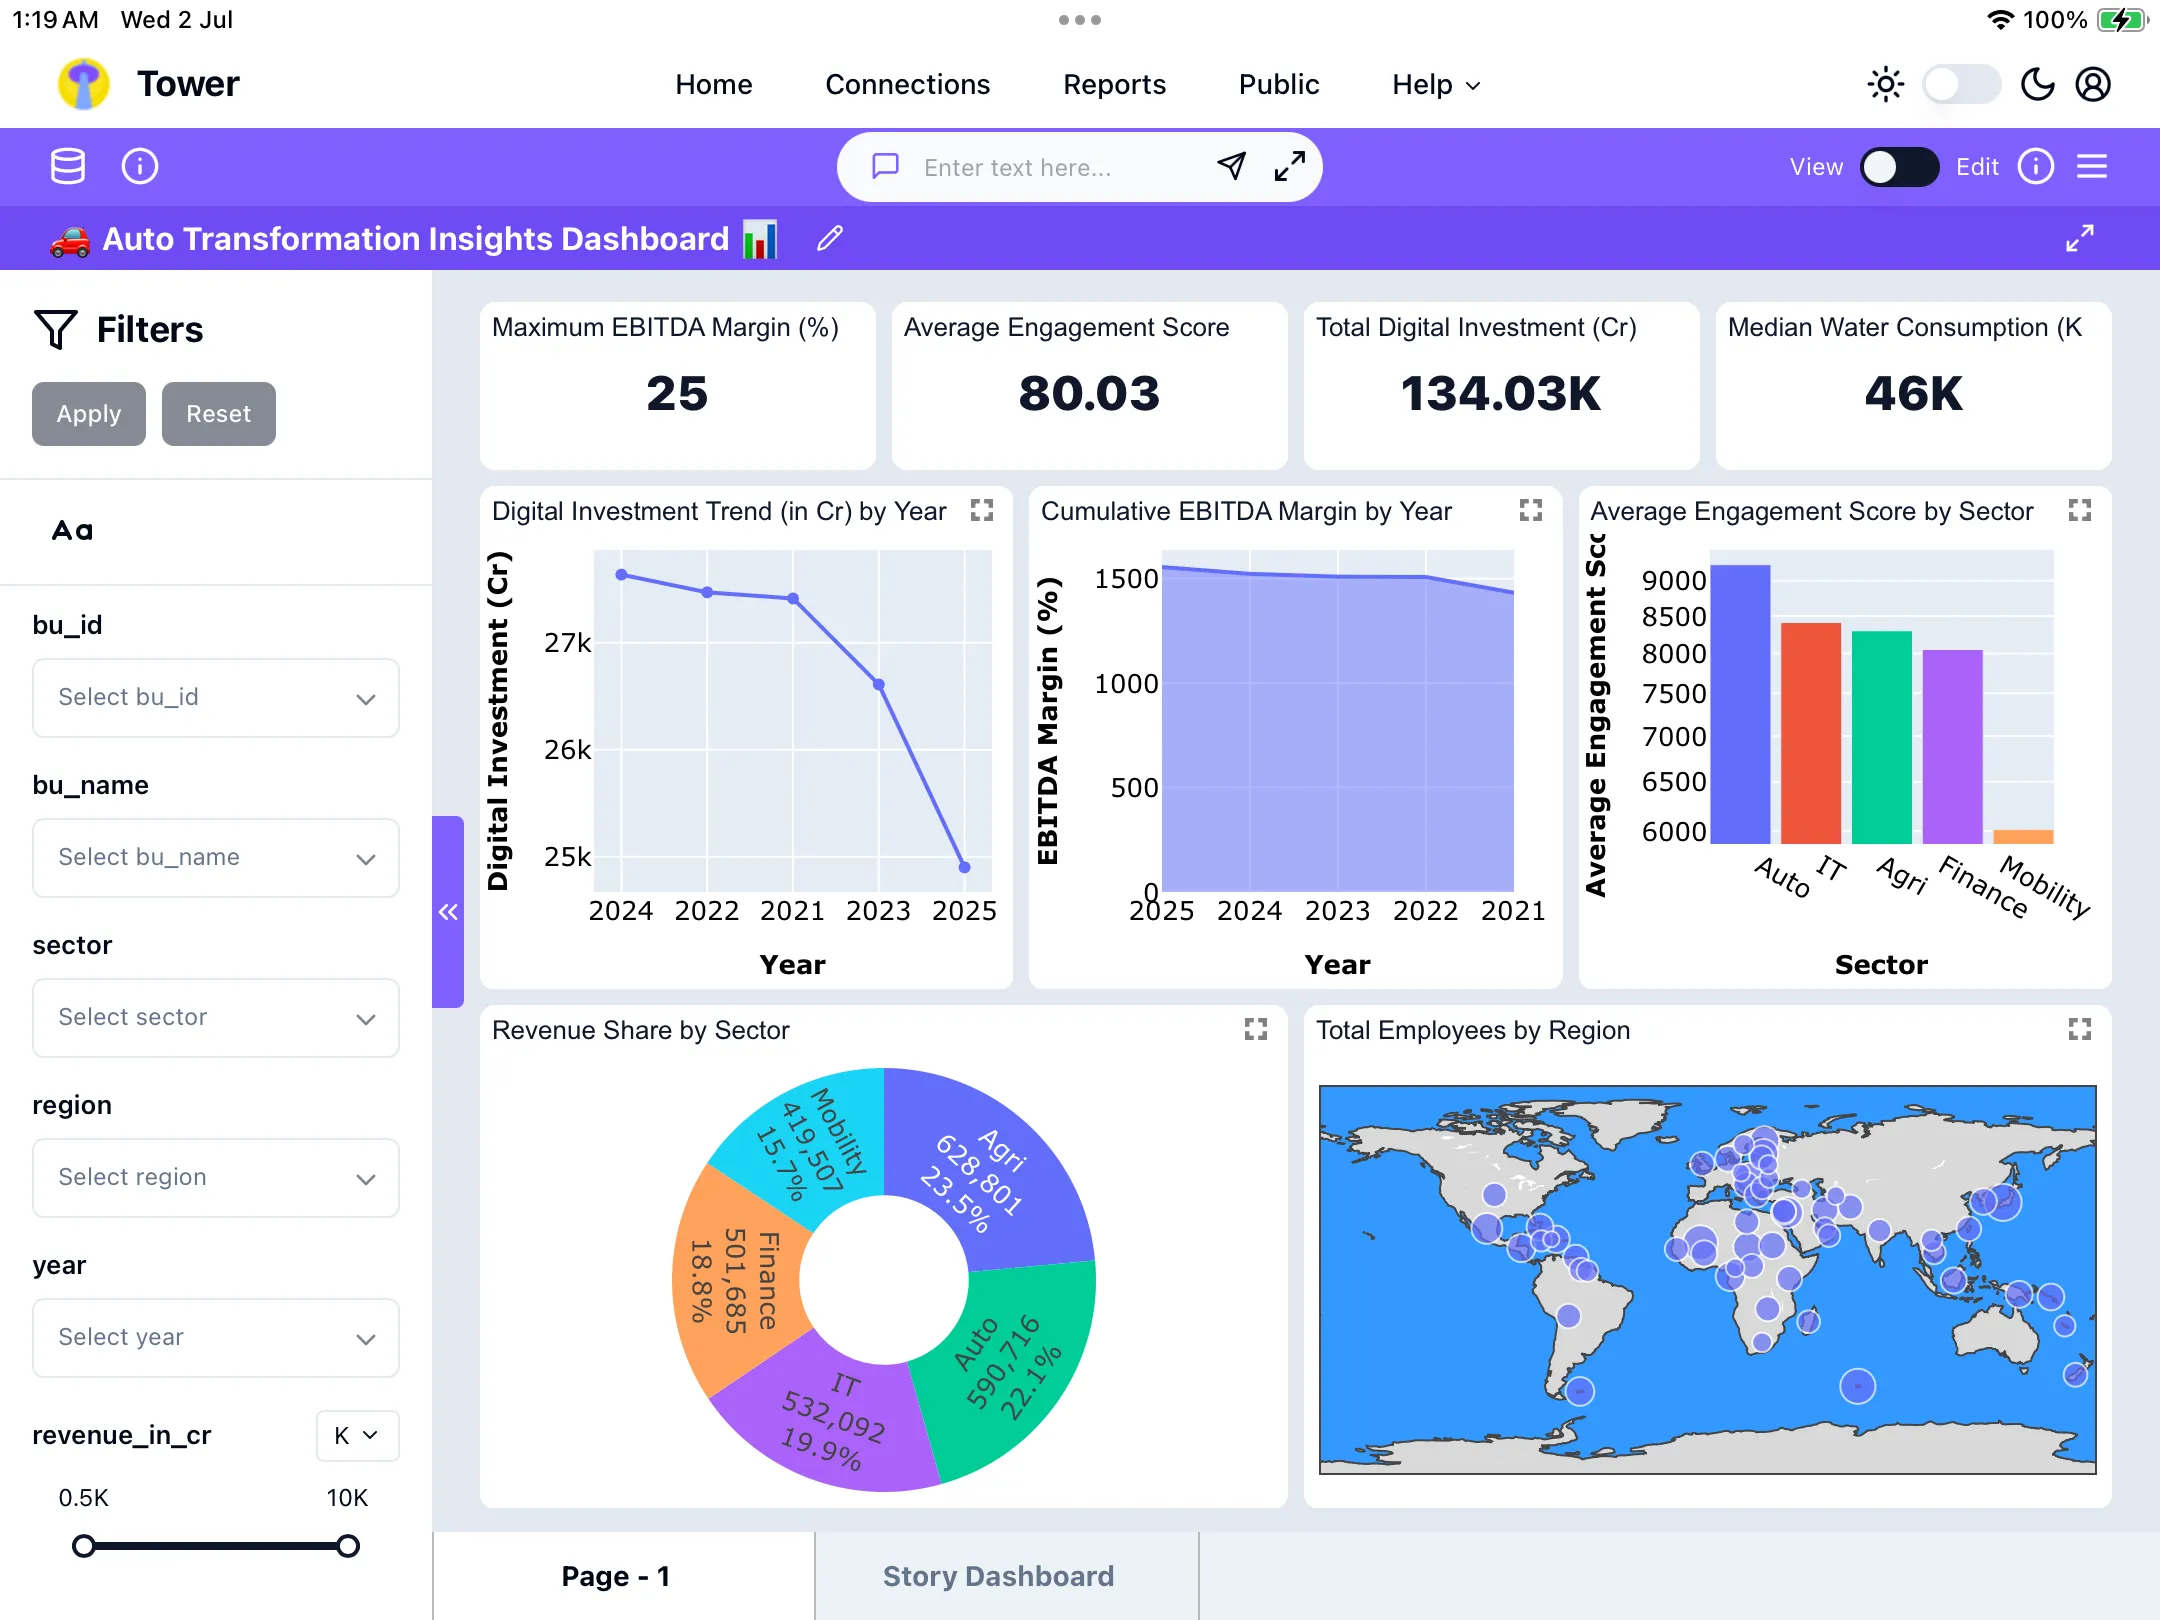
Tower delivers dashboards that think and act while automating your entire data infrastructure. Our agentic AI handles complex data pipelines, transformations, and connections automatically, then creates intelligent dashboards that analyze patterns, predict outcomes, execute workflows, and take action. Full enterprise automation with conversational simplicity.
Minutes to create, seconds to modify
Natural language, no technical skills required
Self-service analytics for executives
How it works
From raw data to action in four steps
Tower automates the work that usually sits between your data and a decision.
Step 01
Connect
Point Tower at a database, warehouse, SaaS app or file: 11 connectors on Professional, 700+ on Enterprise.
No pipelines to build
Step 02
Model
Tower profiles the data, joins the tables, and builds the transformations and semantic layer. A scheduler runs data quality checks on every refresh.
No data modeling
Step 03
Ask
Ask in plain language. Tower builds the dashboard in about 2 minutes, with descriptive, predictive and prescriptive analysis.
No SQL or DAX
Step 04
Act
Create Jira tickets, raise ERP restock requests or assign CRM tasks straight from a chart, or export a Story Mode deck.
No hand-offs
ROI
Estimate Your Savings with Tower
We estimate a five-person team saves $80K to $620K per dashboard project by switching from traditional development to Tower. Calculate your specific savings in under 2 minutes.
Interactive calculator · Real cost comparisons · 2-minute setup
Features
What executives get
Answers, not just charts, from a system you control.
01
Dashboards that explain themselves
Each dashboard points out the trends and outliers that matter, says why they happened and what to do next. Change anything by chat: chart types, filters, calculations or colours.
+Pattern detection
+Prescriptive recommendations
+Edit by chat
02
A control tower for the business
Set alerts on the metrics you care about, schedule refreshes, and choose the data quality rules that run on every refresh. Story Mode turns a dashboard into slides for PowerPoint, PDF or PNG.
+Alerts
+Scheduling and data quality rules
+Story Mode
03
Automation you stay in charge of
Tower builds the connectors, joins, transformations and data lake. You approve the pipelines, the schedules and every action it takes in Jira, ERP or CRM systems.
+No-code pipelines
+Approved actions
+Role-based access
Industry Applications
Trusted Across Industries
From healthcare to manufacturing, Tower delivers insights that matter
01
Manufacturing
Real-time production monitoring and quality control dashboards
+Production efficiency
+Quality scores
+Equipment uptime
+Cost per unit
02
Healthcare
Patient outcomes and operational efficiency tracking
+Patient satisfaction
+Treatment outcomes
+Resource utilization
+Compliance rates
03
Financial Services
Risk management and performance analytics
+Portfolio performance
+Risk exposure
+Compliance status
+Client satisfaction
04
Retail
Sales performance and inventory optimization
+Sales velocity
+Inventory turnover
+Customer lifetime value
+Profit margins
Mobile Apps
Tower Mobile Apps
Experience Tower's full power on iPhone, Android phones, iPad, and Android tablets, with apps available privately on request for Tower subscribers. Perfect for executives who need comprehensive dashboards on a touch screen.
Executive Dashboards, Mobile Optimized
Responsive Dashboard Experience
Dashboards adapt to your screen size - from compact phone views to expansive tablet displays
Touch-Optimized Interface
Navigate dashboards with intuitive touch gestures designed for mobile devices - phones and tablets
AI Chat Integration
Chat with your data using natural language and create new visualizations on any device
Testimonials
What Our Users Say
Feedback from users using Tower to transform their operations
Analytics Dashboards are pretty good on this.
I can easily automate things on this because of its capable ai features.
Integration is very good on this one.
What could be improved:
More features can be added.
It can be made more cost effective.
RC
Rahul C.
Consultant
Small-Business (50 or fewer emp.)
Reviewed on November 27, 2024
Direct Feedback
"It's an agentic AI solution...it has a mind of its own."
What they liked:
This is not a tool. This is an agentic AI solution.
This doesn't compete with Power BI, Tableau or others...it has a mind of its own and understands business very well. Charts are just a way to present insights. What insights to deliver? That is what this product does best.
What could be improved:
Would love to have streaming dashboards. Also a simplified section for just trends that have changed.
AI
Anonymous
CXO, AI & Analytics
Enterprise (1000+ emp.)
Reviewed on April 6, 2025
Direct Feedback
"Embodies the spirit of AI with excellent technical implementation"
What they liked:
Easy to understand. Can create charts just by chatting. Dashboards created out of the box are good.
Love the approach. The core of LLMs is about retrieving relevant data. Analytics is about surfacing the right information at the right time. Tower embodies this spirit with excellent technical implementation.
MD
Anonymous
Managing Director, APAC
Automation Software Vendor
Reviewed on September 20, 2025
Pricing
Enterprise-Ready Pricing
Flexible options for teams of all sizes
Professional
Starting at $100Starting at ₹8,299
per user/month
For small teams and departments
Connect to popular data sources
AI‑generated dashboards
Natural language chat
On‑demand refresh & scheduling
Mobile apps for iPhone, iPad and Android, on request
Key answers for technical and business evaluators.
Tower is an AI analytics platform that automates the BI workflow and makes dashboards actionable. Connect a data source and Tower builds the semantic layer, preprocessing and transformations for you. Quick-generate a dashboard in about 2 minutes, or configure it to suit your team. Each dashboard includes metric visualizations, Story Mode slides with descriptive, predictive and prescriptive analytics (exportable to PowerPoint, PDF or PNG), a conversational AI assistant, a scheduler that runs data quality checks on every refresh, and actions that create Jira tickets, raise ERP restock requests or assign CRM tasks straight from a chart.
Tableau and Power BI are mature BI platforms, and both now have AI assistants (Tableau Agent and Copilot). Their assistants mostly work on data that has already been prepared and modeled. Tower also automates the work before the dashboard: connectors, joins, transformations and the semantic layer. Beyond visualization, Tower dashboards can trigger actions in your other systems. Our comparison pages cover Tableau, Power BI, Qlik and Looker in detail, with sources.
No. If you can describe what you want in plain language, you can use Tower. Instead of writing SQL or DAX, you ask, for example, 'Compare Q3 and Q4 revenue by product line'. Tower handles the queries, transformations, calculations and chart choices.
A first dashboard takes about 2 minutes once a supported data source is connected: Tower profiles the data, builds the data model and transformations, and generates the dashboard. Customizing it through chat takes minutes more. A full enterprise rollout, with private data sources, SSO, roles and team training, typically takes a few weeks. These are our estimates.
Tower doesn't just display data. It identifies trends, predicts outcomes and suggests actions based on your data and business context, so each dashboard tells you what to do next as well as what happened.
Yes, all three in one platform. Descriptive analytics shows what happened, predictive analytics forecasts what is likely to happen, and prescriptive analytics recommends what to do. Tower picks the kind of analysis that fits your question.
Tower Enterprise includes 700+ pre-built connectors covering databases, cloud data warehouses, SaaS applications, APIs and file storage, including PostgreSQL, SQL Server, Snowflake, BigQuery, Salesforce and HubSpot. The Professional plan includes 11 popular connectors: Excel, CSV, MySQL, MS SQL Server, Oracle, PostgreSQL, HubSpot, Airtable, Snowflake, Databricks and TallyPrime. Tower detects your schema and builds the relationships between tables. Need a specific connector? Contact us.
Yes. Plugins for Spotfire, Snowflake (Native App) and Grafana are available on request. They bring natural-language chart generation and descriptive, predictive and prescriptive insights into the BI platform you already use.
Yes. You can change any dashboard through chat or the editor: switch chart types, add filters, adjust calculations or change colours, and Tower updates it straight away.
Tower has solutions for healthcare (with HIPAA-aligned safeguards), life sciences, manufacturing, retail, supply chain and executive dashboards across sectors. Any organization that needs to turn data into decisions quickly can use it.
Tower follows the safeguards that standards such as HIPAA and GDPR call for: role-based access control, encryption at rest and in transit, audit logging and SSO. We don't hold third-party compliance certifications today. As an AI-first company we build these controls into the product, configure each deployment to the standards your organization must meet, and can pursue a specific certification when a customer needs it. Our team has also worked with enterprises like Pfizer and Merck that have stringent security requirements.
Professional is $100 per user per month, with 11 popular connectors and data stored in Tower's cloud data lake. Enterprise has unlimited users on a tiered credits model, 700+ connectors, SSO, RBAC, audit logging and hybrid deployment options for data residency.
Yes. Free trials are available on request. Contact us and we'll plan the trial around your team, data sources and security requirements.
Bring a data source and a question your team asks every week. We'll connect it, build the dashboard and show you the recommended actions during the demo.
We use essential storage to make our site work and, if you allow them, analytics and marketing cookies to understand how our site is used and measure our advertising.
or read our Privacy Policy.
Essential Cookies
Required for the website to function properly. These cannot be disabled.
Analytics Cookies
Help us understand how visitors use our website (Google Analytics, Microsoft Clarity).
Marketing Cookies
Measure our advertising and identify the companies that visit (LinkedIn, Reddit, Apollo.io).
Cookie Preferences
Essential Cookies
Always Active
These cookies are necessary for the website to function and cannot be switched off. They are usually only set in response to actions made by you which amount to a request for services.
Analytics Cookies
Google Analytics and Microsoft Clarity measure visits and record how pages are used (clicks, scrolling, session recordings with form input masked), so we can improve the website.
Marketing Cookies
LinkedIn and Reddit measure our advertising and may show you our ads on their platforms; Apollo.io identifies the company a visit comes from. Reddit loads only for visitors arriving from Reddit.